Market Movers Last week, 266 originators switched companies and 1,823 individuals obtained their...
Market Movers
Last week, 504 originators switched companies and 1,086 individuals obtained their NMLS license. Notable originator movements last week include:
- Julian Babby ($108M, 384 units) joined United Mortgage Lending LLC
- Randall Bongard ($79.2M, 203 units) joined Blair Allen Mortgage, LLC
- James Hobson ($72.8M, 154 units) joined NEXA Mortgage, LLC
- Michael Brennan ($65.5M, 197 units) joined Zillow Home Loans, LLC
- Todd Henley ($65.3M, 120 units) joined CrossCountry Mortgage, LLC
- Andrew Deyo ($63.3M, 150 units) joined NEXA Mortgage, LLC
- Brendan Williams ($62.4M, 154 units) joined Barrett Financial Group, L.L.C.
- Jesus Garcia ($62M, 203 units) joined West Capital Lending, Inc.
- Christopher Hoss ($61.9M, 205 units) joined Mutual of Omaha Mortgage, Inc.
- Josh Allyn ($54.8M, 234 units) joined New American Funding, LLC
- Alan Blood ($54.6M, 120 units) joined Summit Home Loans LLC
- Dustin Bingaman ($53.8M, 96 units) joined CrossCountry Mortgage, LLC
- Julian Sanchez Real ($52.6M, 167 units) joined Onemortgage llc
- Charles Baldon ($48.9M, 129 units) joined Loomis Home Mortgage LLC
Figures are based on last 14 months’ production.
Market Movers (Gainers by Producer Volume)
Top Gainers (non-Bank/CU):
- Carrington Mortgage Services, LLC +21.12%
- Resource Financial Services, Inc. +9.81%
- American Pacific Mortgage Corporation +8.23%
- LoanPeople, LLC +5.66%
- Madison Mortgage Services Inc. +5.32%
- Advantage Mortgage, Inc. +5.12%
- Future Mortgage +4.99%
- Union Home Mortgage Corp. +4.94%
- Lending Force, LLC +3.51%
- Loan Pronto, Inc. +3.13%
- Rize Mortgage +3.06%
- Lumin Lending Inc. +2.86%
- Coast2Coast Mortgage, LLC +2.81%
- MY COMMUNITY MORTGAGE LLC +2.25%
- HMA Mortgage +1.82%
- Churchill Mortgage Corporation +1.77%
- Federal First Lending LLC +1.7%
Calculations based on last aggregate production of individual LO’s 14 months’ production. Excludes companies below $200M in 14mo LO production value after gains factored in.
Which States Have the Most Women Mortgage Loan Originators? 2026 State Rankings
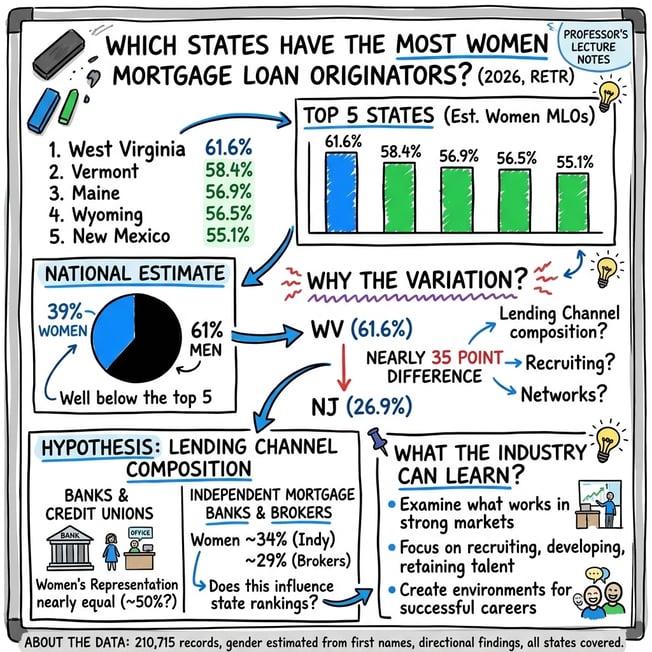
Women represent an estimated 39% of mortgage loan originators nationally. But in several states, women appear to make up the majority.
Last week, RETR examined gender representation among more than 210,000 mortgage loan originators, representing approximately $2.44 trillion in production over 14 months.
This week, we're taking a closer look at geography.
Which states have the strongest representation of women in mortgage lending, and what can the industry learn from those markets?
The Top 5 States for Women in Mortgage Origination
Using our best-effort gender estimates based on first names, we identified the states with the highest estimated female representation among active mortgage originators.
|
Rank |
State |
Estimated Women |
|
1 |
West Virginia |
61.6% |
|
2 |
Vermont |
58.4% |
|
3 |
Maine |
56.9% |
|
4 |
Wyoming |
56.5% |
|
5 |
New Mexico |
55.1% |
West Virginia leads the nation, with women estimated to represent nearly 62% of mortgage loan originators.
Vermont, Maine, Wyoming, and New Mexico also exceed 55%, well above the national estimate of approximately 39%.
And the trend extends beyond the top five. Our analysis identified 10 states where women appear to represent at least half of active mortgage originators.
Why Does Women's Representation Vary So Much by State?
One of the most interesting findings is the geographic variation.
Our estimates suggest women's representation ranges from 61.6% in West Virginia to 26.9% in New Jersey.
That's nearly a 35-percentage-point difference.
What makes these markets so different?
Could it be the types of mortgage companies operating in each state? Differences in recruiting and career development? Or stronger professional networks supporting women in mortgage origination?
Our previous research found that women's estimated representation is nearly equal at banks and credit unions, compared with approximately 34% at independent mortgage banks and 29% among mortgage brokers.
Could differences in lending-channel composition help explain these geographic variations?
Women's Representation in Mortgage Lending: All 50 States and Washington, D.C.
Below is RETR's geographic ranking of estimated female representation among active mortgage loan originators, based on office location.
1. West Virginia (61.6%)
2. Vermont (58.4%)
3. Maine (56.9%)
4. Wyoming (56.5%)
5. New Mexico (55.1%)
6. North Dakota (55.0%)
7. Alaska (53.5%)
8. Montana (52.6%)
9. Louisiana (51.0%)
10. South Dakota (50.0%)
11. Pennsylvania (47.8%)
12. Arkansas (47.6%)
13. Indiana (47.5%)
14. Hawaii (47.5%)
15. Wisconsin (47.1%)
16. Iowa (46.6%)
17. Nebraska (46.6%)
18. Alabama (45.5%)
19. North Carolina (45.1%)
20. Oregon (44.9%)
21. Massachusetts (44.3%)
22. Virginia (44.3%)
23. Idaho (44.2%)
24. Oklahoma (43.8%)
25. New Hampshire (43.3%)
26. Washington (43.2%)
27. Kentucky (42.6%)
28. Tennessee (42.4%)
29. Nevada (42.1%)
30. Mississippi (41.8%)
31. Ohio (41.5%)
32. Connecticut (41.4%)
33. Kansas (40.6%)
34. Georgia (40.4%)
35. Delaware (39.8%)
36. Rhode Island (38.2%)
37. Texas (38.1%)
38. Illinois (38.1%)
39. Washington, D.C. (38.1%*)
40. Florida (38.0%)
41. Colorado (38.0%)
42. South Carolina (37.8%)
43. Michigan (36.3%)
44. New York (35.8%)
45. Minnesota (35.4%)
46. Utah (34.1%)
47. Missouri (33.7%)
48. California (32.3%)
49. Maryland (30.5%)
50. Arizona (29.8%)
51. New Jersey (26.9%)
All states and D.C. are included, regardless of sample size. Estimates for markets with smaller originator populations may be more sensitive to individual name classifications.
What Can the Mortgage Industry Learn?
Rather than focusing exclusively on where women are underrepresented, perhaps the more valuable question is what's working in the states where women already have the strongest representation?
For mortgage executives focused on recruiting, developing, and retaining talent, these findings offer an opportunity to examine what distinguishes those markets.
Understanding those differences could help more lenders create environments where women can build successful, long-term careers in mortgage origination.
The opportunity isn't simply to increase women's participation in mortgage lending. It's to learn from the markets where women are already strongly represented.
About the Data: RETR analyzed 210,715 mortgage originator records covering 14 months of production. Geographic rankings include active originators with assigned office locations. Gender was estimated from first names using common naming conventions. All 50 states and Washington, D.C., are included without a minimum sample-size cutoff. Findings are directional, not verified gender statistics. Differences in name-estimation coverage and lender composition may influence the estimates.
Upcoming RETR Training
-
- Mon, Nov 9 @ 2p ET - Intro to RETR: The Modern Loan Officer’s Data Advantage Register
- Tues, Nov 10 @ 1p ET - The Track Record Advantage: Help Your Agents Win More Offers and Listings Register
Is RETR Better?
When it comes to mortgage market intelligence, you have a handful of options, and RETR is one that truly stands out. Here’s what Kayla Kallandar, a top producer at First International Bank & Trust has to say about RETR: “The smarter, easier-to-use data from RETR helps me have better strategic conversations with my agent partners.”

But you don’t have to take their word for it. RETR offers a free trial to individuals and organizations to judge the quality of the data and insights for themselves.