
Market Movers Last week, 212 originators switched companies and 1,021 individuals obtained their...
Market Movers
Last week, 285 originators switched companies and 1,231 individuals obtained their NMLS license. Notable originator movements last week include:
- Anas Shakir ($244.8M, 777 units) joined Afex Mortgage LLC
- John Kearney ($128M, 519 units) joined Farmers Bank
- Roger Kube ($124.6M, 170 units) joined Mutual of Omaha Mortgage, Inc.
- Tanja Allen ($110.9M, 344 units) joined CMG Mortgage, Inc.
- Trisha Mcconkey ($86.1M, 97 units) joined Regions Bank
- Jose Mendez ($73.9M, 265 units) joined Hometown Lending Inc
- Dennis Walsh ($73.7M, 93 units) joined Prosperity Bank
- Matthew Squires ($67.9M, 152 units) joined Mutual of Omaha Mortgage, Inc.
- Giovanni Ammori ($64.4M, 218 units) joined Afex Mortgage LLC
- Rebecca Villasenor ($63.8M, 127 units) joined HomeAmerican Mortgage Corporation
- James Kott ($63.8M, 116 units) joined Green Lending LLC
- Lionel Garcia ($59.3M, 165 units) joined Heritage Mortgage, LLC
- Atanasio Aguilera ($53.2M, 142 units) joined CMG Mortgage, Inc.
Figures are based on last 14 months’ production.
Market Movers (Gainers by Producer Volume)
Top Gainers (non-Bank/CU):
- Hometown Lending Inc +44.91%
- Green Lending LLC +20.63%
- Priority 1 Lending, LLC +8.23%
- One Real Mortgage Corp. +5.97%
- 4Ever Lending USA LLC +5.01%
- Green Home Loans LLC +3.18%
- Keystone Funding, Inc. +2.94%
- First Savings Mortgage Corporation +2.68%
- Trailblazer Mortgage L.L.C. +2.26%
- HomeAmerican Mortgage Corporation +2.16%
-
GVC Mortgage, Inc. +1.76%
Calculations based on last aggregate production of individual LO’s 14 months’ production. Excludes companies below $100M in 14mo LO production value after gains factored in.
Beyond State Rankings: Agent Loyalty Index by County
Some mortgage markets are simply harder to break into than others.
Not because they produce fewer homebuyers.
Not because there are fewer Realtors.
But because Realtor-lender relationships are fundamentally different.
Until now, there hasn't been a way to measure those differences.
Last week, we introduced the Agent Loyalty Index (ALI) and found that Realtor loyalty varies meaningfully from state to state.
This week, we zoomed in.
We analyzed hundreds of thousands of Realtor-lender relationships at the county level and discovered that local relationship dynamics vary even more dramatically than state averages suggest.
If you're using the same sales strategy in every market, you may already be at a disadvantage.
What Is the Agent Loyalty Index?
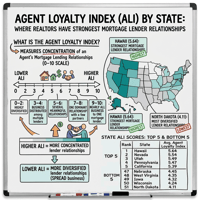
The Agent Loyalty Index (ALI) measures how consistently a real estate agent works with the same mortgage lender versus distributing business across multiple lending partners.
It is measured on a 0–10 scale.
- 9–10: Nearly all business goes to one lender.
- 7–8: One dominant lending relationship with a few secondary partners.
- 5–6: Several meaningful lender relationships.
- 3–4: Business is distributed across multiple lenders.
- 0–2: Highly diversified with no clear preferred lending partner.
A higher ALI indicates more concentrated mortgage lender relationships. A lower ALI indicates Realtor business is distributed across a broader group of lending partners.
The Agent Loyalty Index doesn't measure whether a market is "good" or "bad." It measures how concentrated Realtor-lender relationships are within that market.
For this analysis, we included only counties with at least 50 producing real estate agents located in that county in order to ensure meaningful comparisons.
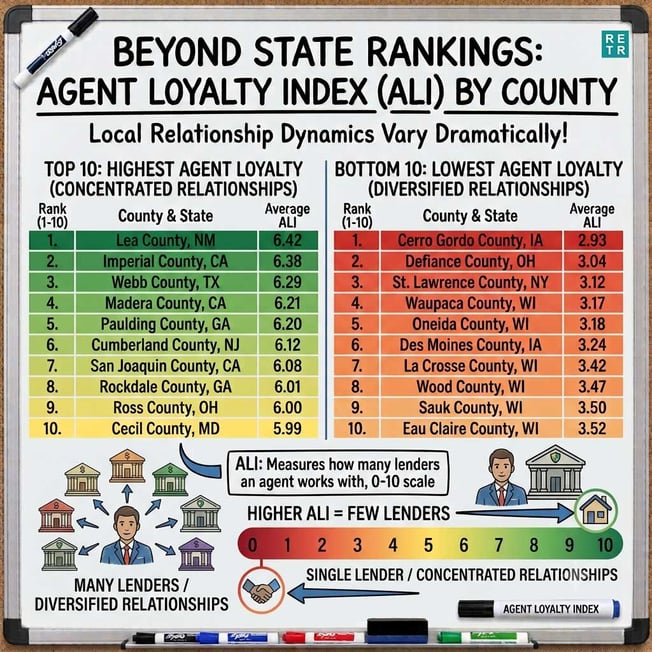
Counties with the Highest Agent Loyalty Index
Among qualifying counties, these markets exhibited the most concentrated Realtor-lender relationships.
| Rank | County | State | Agent Loyalty Index |
| 1 | Lea | NM | 6.42 |
| 2 | Imperial | CA | 6.38 |
| 3 | Webb | TX | 6.29 |
| 4 | Madera | CA | 6.21 |
| 5 | Paulding | GA | 6.2 |
| 6 | Cumberland | NJ | 6.12 |
| 7 | San Joaquin | CA | 6.08 |
| 8 | Rockdale | GA | 6.01 |
| 9 | Ross | OH | 6 |
| 10 | Cecil | MD | 5.99 |
| 11 | Lebanon | PA | 5.98 |
| 12 | Stanislaus | CA | 5.95 |
| 13 | Saint Louis City | MO | 5.94 |
| 14 | Montgomery | VA | 5.94 |
| 15 | Weber | UT | 5.86 |
| 16 | Yolo | CA | 5.84 |
| 17 | Prince Georges | MD | 5.84 |
| 18 | San Bernardino | CA | 5.82 |
| 19 | Clinton | NY | 5.82 |
| 20 | Bucks | PA | 5.82 |
| 21 | Chesapeake City | VA | 5.82 |
| 22 | Walton | GA | 5.81 |
| 23 | Sutter | CA | 5.8 |
| 24 | Gloucester | NJ | 5.8 |
| 25 | Monroe | NY | 5.79 |
Counties with the Lowest Agent Loyalty Index
These counties demonstrated the most diversified Realtor-lender relationships:
| Rank | County | State | Agent Loyalty Index |
| 1 | Cerro Gordo | IA | 2.93 |
| 2 | Defiance | OH | 3.04 |
| 3 | Saint Lawrence | NY | 3.12 |
| 4 | Waupaca | WI | 3.17 |
| 5 | Oneida | WI | 3.18 |
| 6 | Des Moines | IA | 3.24 |
| 7 | La Crosse | WI | 3.42 |
| 8 | Wood | WI | 3.47 |
| 9 | Sauk | WI | 3.5 |
| 10 | Eau Claire | WI | 3.52 |
| 11 | McCracken | KY | 3.53 |
| 12 | Outagamie | WI | 3.53 |
| 13 | Adams | IL | 3.55 |
| 14 | Boyd | KY | 3.55 |
| 15 | Marathon | WI | 3.56 |
| 16 | Portage | WI | 3.56 |
| 17 | Sheboygan | WI | 3.56 |
| 18 | Bulloch | GA | 3.58 |
| 19 | Burleigh | ND | 3.59 |
| 20 | Manitowoc | WI | 3.59 |
| 21 | Lafayette | MS | 3.65 |
| 22 | Franklin | MO | 3.66 |
| 23 | Aroostook | ME | 3.67 |
| 24 | Crow Wing | MN | 3.69 |
Download the Full Agent Loyalty Index by County Here
Why County-Level Analysis Matters
The difference between Lea County, New Mexico (6.42) and Cerro Gordo County, Iowa (2.93) illustrates just how differently Realtor relationships can develop from one local area to another.
Markets with higher Agent Loyalty Index scores tend to have more concentrated lender relationships, where Realtors consistently work with a smaller group of preferred lending partners.
Markets with lower scores generally reflect a broader distribution of business across multiple lenders.
Neither environment is inherently better.
But they represent very different competitive landscapes.
A loan officer entering a market where relationships are highly concentrated faces a different challenge than one entering a market where Realtors routinely work with multiple lenders.
Production tells you how much business exists.
The Agent Loyalty Index helps explain how that business is distributed.
That's a dimension of mortgage market intelligence the industry has never had before.
A Better Way to Understand Your Market
Every market has its own relationship dynamics.
Until now, those dynamics were largely invisible.
The Agent Loyalty Index makes them measurable.
Whether you're expanding into a new territory, recruiting loan officers, prioritizing Realtor outreach, or evaluating market opportunities, understanding how concentrated local Realtor relationships are provides context that transaction volume alone cannot.
The obvious next question is: What does your market look like?
Because if Realtor loyalty varies this much from one county to the next, your local competitive landscape may be very different than you think.
Upcoming RETR Training
-
- Mon, July 13 @ 2p ET - Intro to RETR: The Modern Loan Officer’s Data Advantage Register
- Wed, July 15 @ 1p ET - From Lost Deals to Lifelong Clients: Leveraging Loan Loss & Home Value Reports in RETR Register
Is RETR Better?
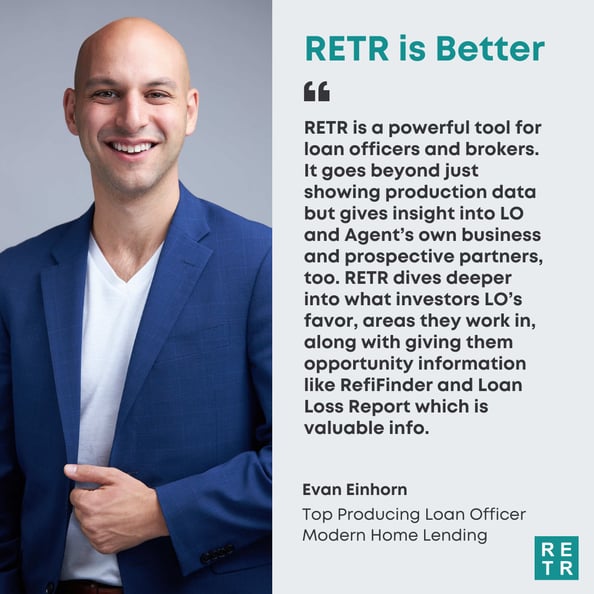
When it comes to mortgage market intelligence, you have a handful of options, and RETR is one that truly stands out. Here’s what Evan Einhorn, Top Producer at Modern Home Lending has to say about RETR: “RETR is a powerful tool for loan officers and brokers. It goes beyond just showing production data but gives insight into LO and Agent’s own business and prospective partners, too. RETR dives deeper into what investors LO’s favor, areas they work in, along with giving them opportunity information like Refi Finder and Loan Loss Report which is valuable info.”
But you don’t have to take their word for it. RETR offers a free trial to individuals and organizations to judge the quality of the data and insights for themselves.