

Market Movers
Last week, 505 originators switched companies and 1,336 individuals obtained their NMLS license. Notable originator movements last week include:
- Austin Lampson ($161.4M, 185 units) joined CrossCountry Mortgage, LLC
- Adam West ($121.2M, 267 units) joined GoRascal Inc.
- Jeffrey Lindsay ($102.6M, 245 units) joined Hilltop Home Loans
- Kelley Christianer ($81.9M, 253 units) joined Mission Loans, LLC
- Baharak Maleki ($80.9M, 119 units) joined American Pacific Mortgage Corporation
- Ryan Larussa ($77.5M, 270 units) joined American Pacific Mortgage Corporation
- James Bickley ($74.8M, 247 units) joined American Pacific Mortgage Corporation
- James Swift ($72.8M, 167 units) joined American Pacific Mortgage Corporation
- Justin Padron ($68.5M, 108 units) joined Princeton Mortgage Corporation
- Shahzein Syed ($65.8M, 165 units) joined United Nations Federal Credit Union
- Darryle Royal ($63.2M, 172 units) joined loanDepot
- Teresa Odette ($62.4M, 79 units) joined American Pacific Mortgage Corporation
- Misty Hemphill-Wilson ($58.8M, 177 units) joined CrossCountry Mortgage, LLC
- Jacob Berezhinskiy ($57.1M, 185 units) joined Parkstone Mortgage, LLC
- Gregg Pechmann ($56.6M, 215 units) joined CrossCountry Mortgage, LLC
- Zachary Mcgrath ($55.8M, 169 units) joined loanDepot
- Alexandra Tyler ($54.9M, 164 units) joined Integrity Home Mortgage Corporation
- Benjamin Nelson ($52.2M, 121 units) joined American Pacific Mortgage Corporation
Figures are based on last 14 months’ production.
Market Movers (Gainers by Producer Volume)
Top Gainers (non-Bank/CU):
- Princeton Mortgage Corporation +14.5%
- Ultimate Mortgage Brokers, LLC +14.39%
- Mortgage300 Corporation +14.14%
- Mission Loans, LLC +11.51%
- American Pacific Mortgage Corporation +8.1%
- Lumin Lending Inc. +7.67%
- Republic State Mortgage Co. +6.71%
- American Security Mortgage Corp +6.71%
- InterLinc Mortgage Services, LLC +5.67%
- GRIFFIN FUNDING, INC. +4.8%
- GoRascal +4.74%
- Integrity Home Mortgage Corporation +4.5%
Calculations based on last aggregate production of individual LO’s 14 months’ production. Excludes companies below $100M in 14mo LO production value after gains factored in.
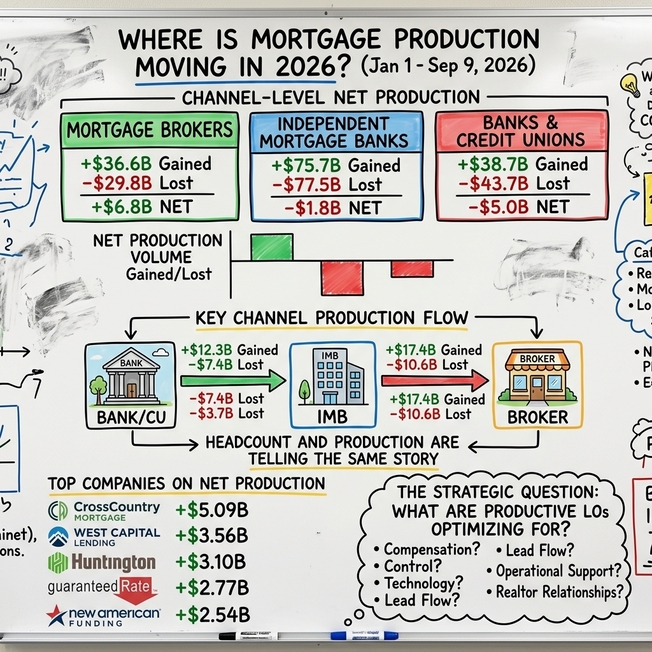
Where Is Mortgage Production Moving in 2026?
In Part 1, we looked at where loan officers are moving. Now the next important question:
How much production is moving with them?
RETR analyzed the historical production volume associated with loan officers who changed companies between January 1 and September 9, 2026.
The channel-level results were clear:
Mortgage Brokers
- $36.6B gained
- $29.8B lost
- +$6.8B net
Independent Mortgage Banks
- $75.7B gained
- $77.5B lost
- -$1.8B net
Banks and Credit Unions
- $38.7B gained
- $43.7B lost
- -$5.0B net
Just as we saw with LO headcount, brokers were the only major channel with positive net production movement.
The Same Channel Pattern Shows Up in Production
The largest cross-channel production flow was between IMBs and brokers.
LOs moving from IMBs to brokers represented approximately $17.4 billion in production volume.
Going the other direction, LOs moving from brokers to IMBs represented approximately $10.6 billion.
That creates roughly $6.8 billion in net production flowing from IMBs to brokers.
A similar pattern appears between banks and IMBs.
LOs moving from banks and credit unions to IMBs represented approximately $12.3 billion in production, while LOs moving from IMBs to banks and credit unions represented about $7.4 billion.
That’s roughly $4.9 billion in net production moving from banks/CUs to IMBs.
Put it together, and the production flow looks a lot like the headcount flow from Part 1:
Bank / Credit Union → IMB → Broker
Headcount and Production Are Telling the Same Story
That consistency is what makes the trend notable.
Brokers didn’t just gain more LOs than they lost. They also gained more production than they lost.
Banks and credit unions lost both net headcount and net production.
And IMBs again landed in the middle — gaining production from banks while losing production to brokers.
If headcount were moving one way and production another, the picture would be much less clear.
So far in 2026, they are largely pointing in the same direction.
Which Companies Are Winning on Net Production?
The channel trend does not mean every company within a channel is moving the same way.
Several lenders are standing out as clear net production winners.
CrossCountry Mortgage led our analysis with approximately +$5.09 billion in net production volume gained.
It was followed by:
- West Capital Lending: +$3.56B
- Huntington National Bank: +$3.10B
- Guaranteed Rate: +$2.77B
- New American Funding: +$2.54B
Other top-10 net gainers included Lakeview Loan Servicing, Fifth Third Bank, Pinnacle Bank, Barrett Financial Group, and Cornerstone First Mortgage.
That list spans multiple channels, reinforcing an important point:
Channel trends matter, but individual companies can still outperform them.
What Is Production Following?
The data tells us where production is moving.
It does not tell us why.
But it raises an important question for mortgage leaders:
What are productive loan officers optimizing for when they choose their next platform?
Compensation? Control? Technology? Lead flow? Operational support? Realtor relationships?
Whatever the answer, through September 9, 2026, both LO headcount and production volume are showing the same broader pattern:
Bank / Credit Union → IMB → Broker
And at the company level, the biggest winners are the firms attracting more production than they are losing.
Source: RETR Data Intelligence Platform. LO movement from January 1 through September 9, 2026. Volume reflects historical production associated with moving loan officers.
Upcoming RETR Training
-
- Mon, Oct 12 @ 2p ET - Intro to RETR: The Modern Loan Officer’s Data Advantage Register
- Wed, Oct 14 @ 1p ET - RETR Office Hours: Bring Your Questions, Leave With Answers Register
Is RETR Better?
When it comes to mortgage market intelligence, you have a handful of options, and RETR is one that truly stands out. Here’s what Jordan Komm, a top producer at Evolution Mortgage has to say about RETR: “As a loan officer, I use RETR every single day and it’s become a critical part of my business. The platform is incredibly user friendly, yet delivers powerful and accurate data. There simply isn't a better tool for identifying the right realtor partnerships and ensuring my clients are connected with other top-producing real estate professionals.”

But you don’t have to take their word for it. RETR offers a free trial to individuals and organizations to judge the quality of the data and insights for themselves.